-
The pros and cons of the “one big tree”

I’ve recently been corresponding with a person in Canada who had come across their deceased father in the Cromar-Robb Hypothesis tree I authored using the Ancestry platform. They wanted to know how their father came to be listed in my tree, and what our connections might be. Using my tree, I traced our most recent…
-
Migrations I: from Aboyne to the four corners of the earth

Dunedin On the east coast of New Zealand’s South Island lies the small city of Dunedin (duh-NEE-din), named in honor of the capital of Scotland, Edinburgh (ED-in-bur-ah , not eed-in-burg), which is confusing unless you are aware of the Gàidhlig name of that ancient city: Dùn Èideann (tun-EE-chin). There are other Dunedins in the world…
-
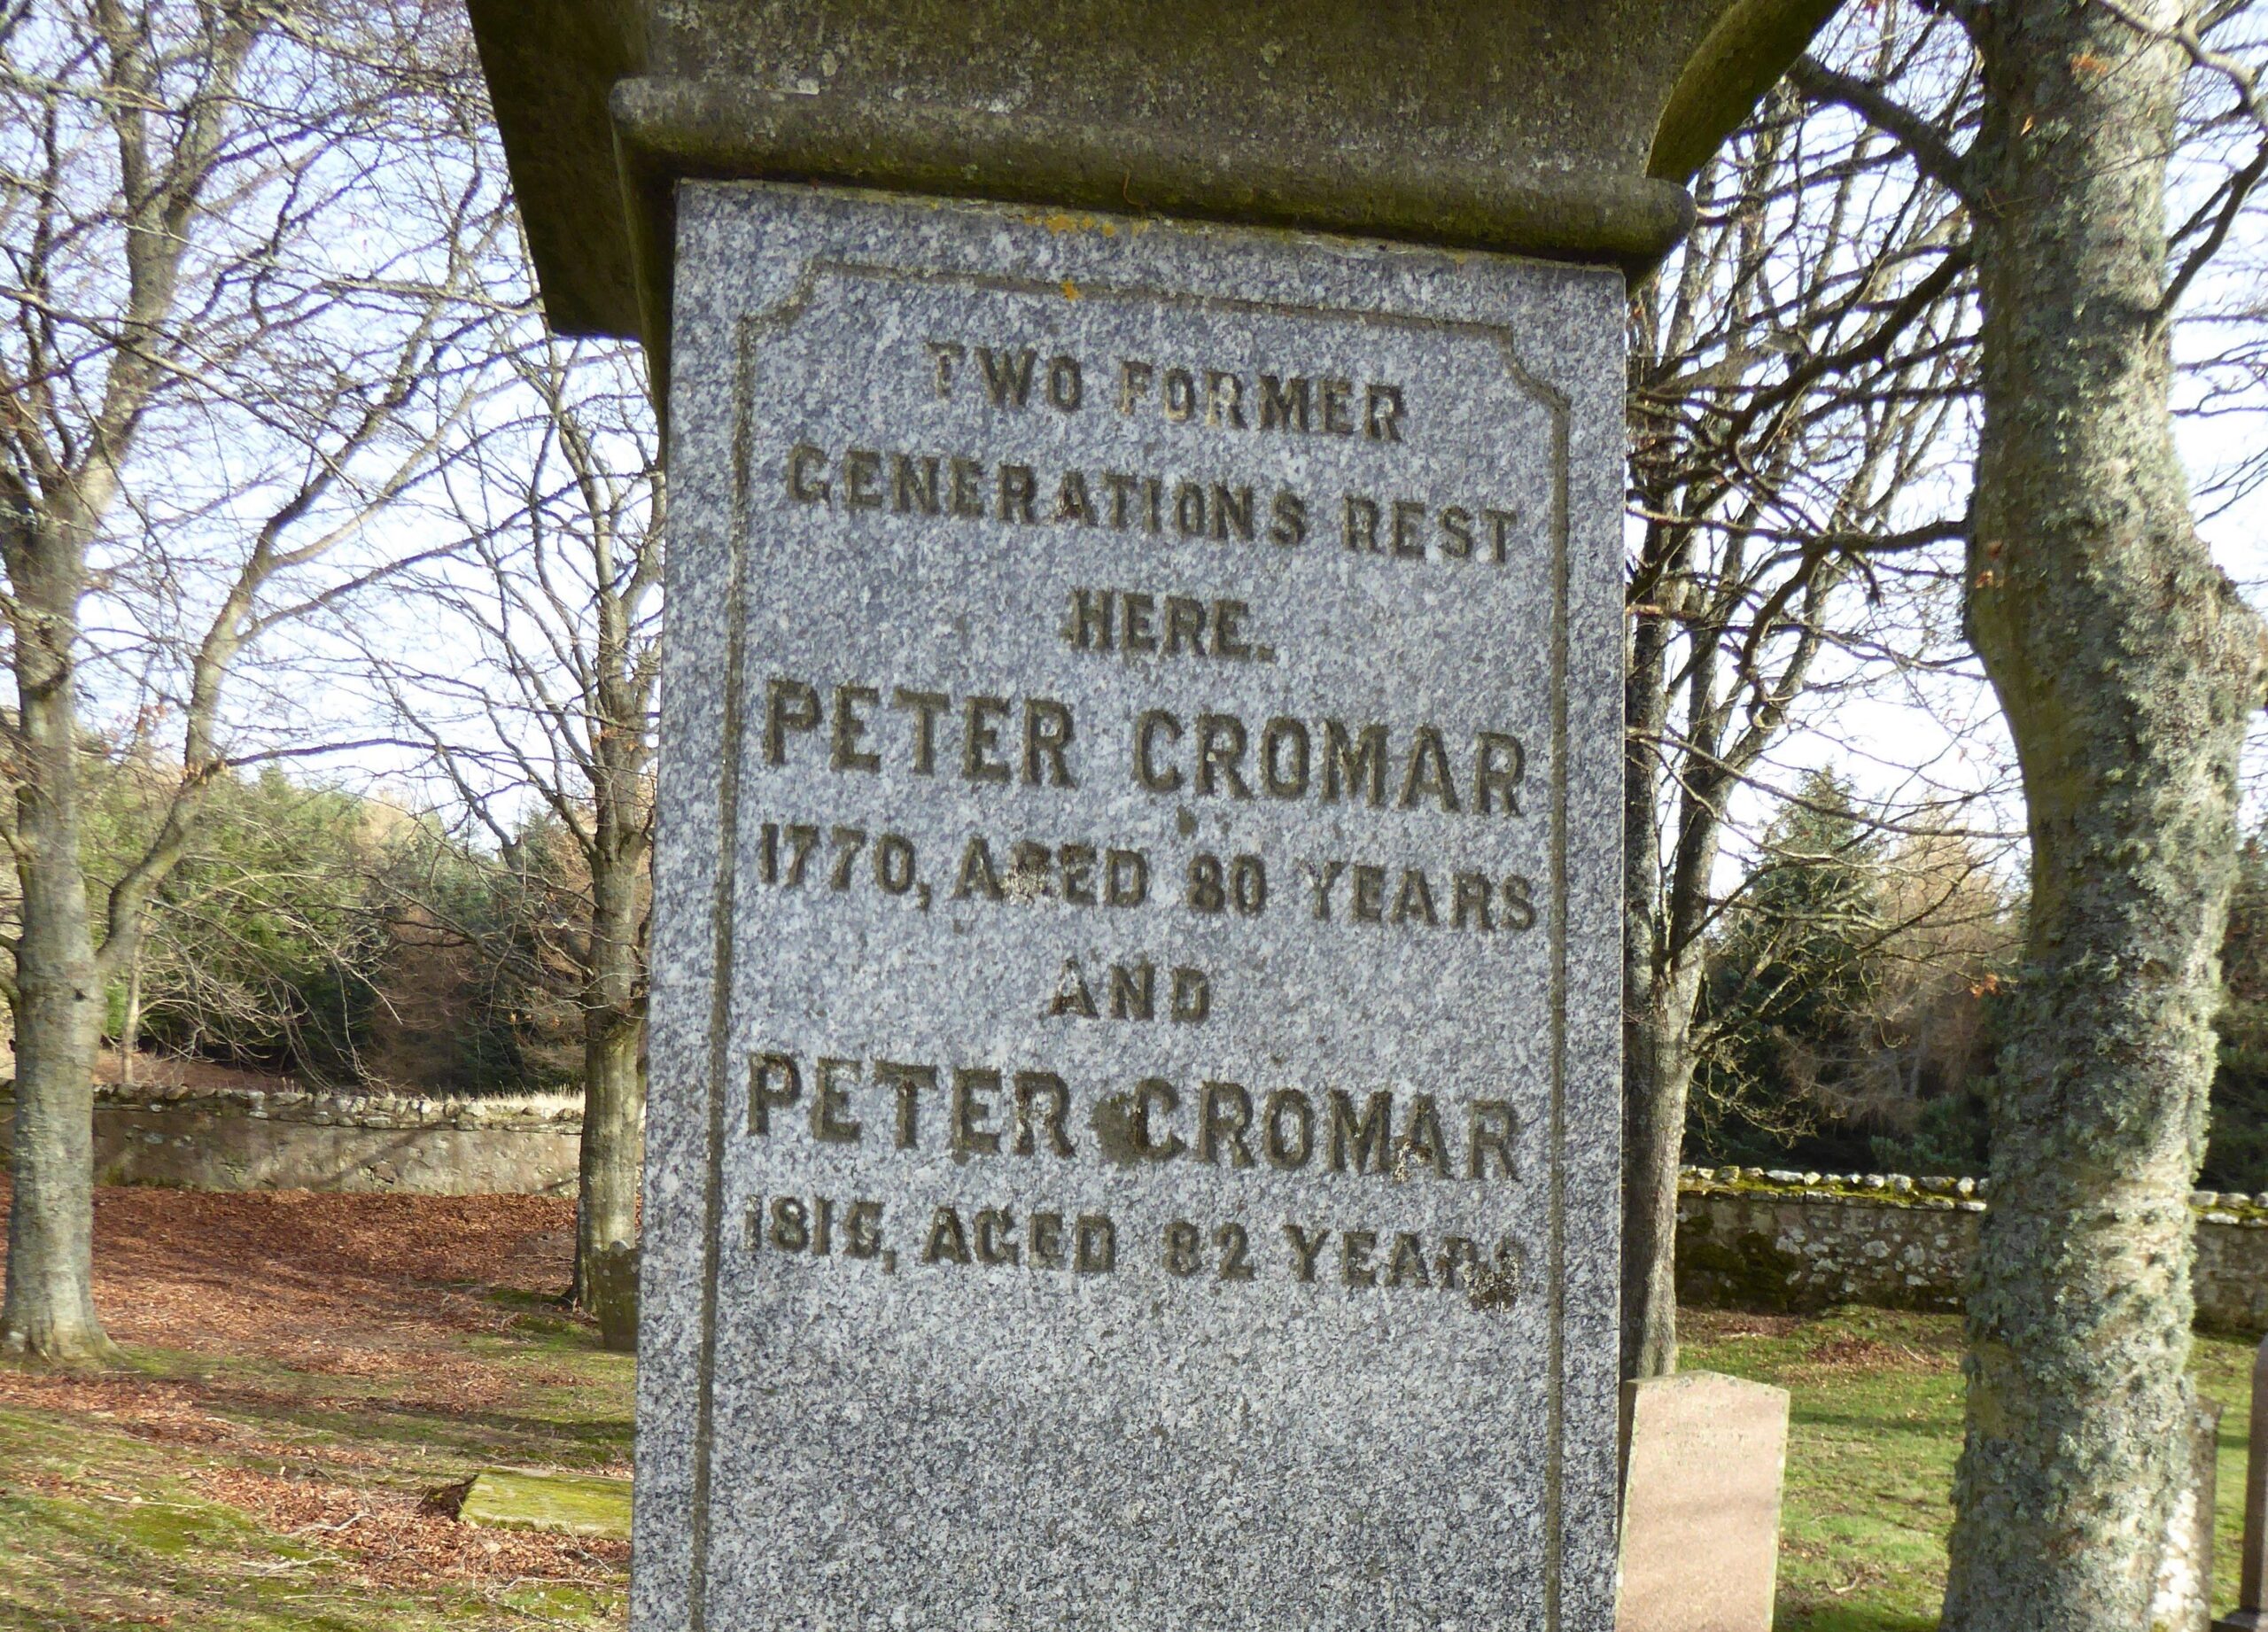
Peter Cromar 1690 descendancy study is complete!

Six months Six months to the day after I received Ron Cromar’s notes from Paul Smillie, I finalized the descendancy study for our progenitor Peter Cromar. If you wish to cut right to the chase and see the results, you’ll notice a new link in the menu above: Database. As of this writing, the compilation…
-
Anniversaries, outreach, and progress

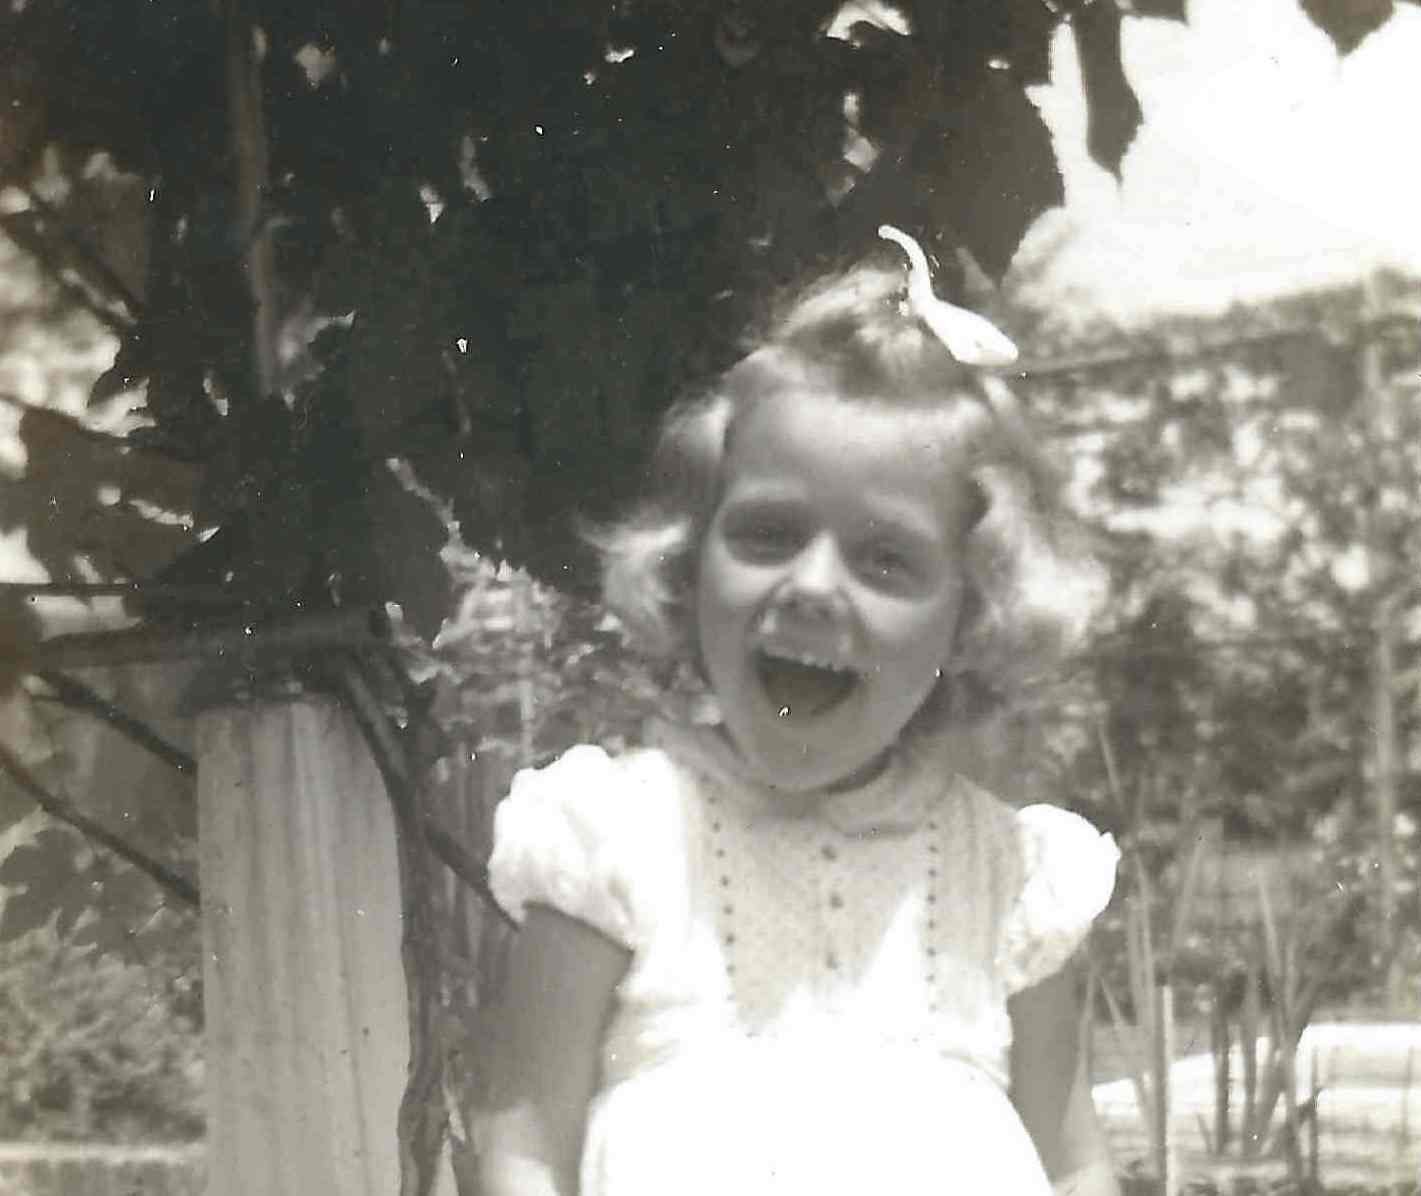
Two anniversaries This is a big anniversary in a couple of ways, and while I don’t want to interrupt the flow of documentation this blog is intended to journal, it would respect the spirit of this work to include a brief mention. My mother’s passing First and foremost, this week marks the anniversary of my…
-
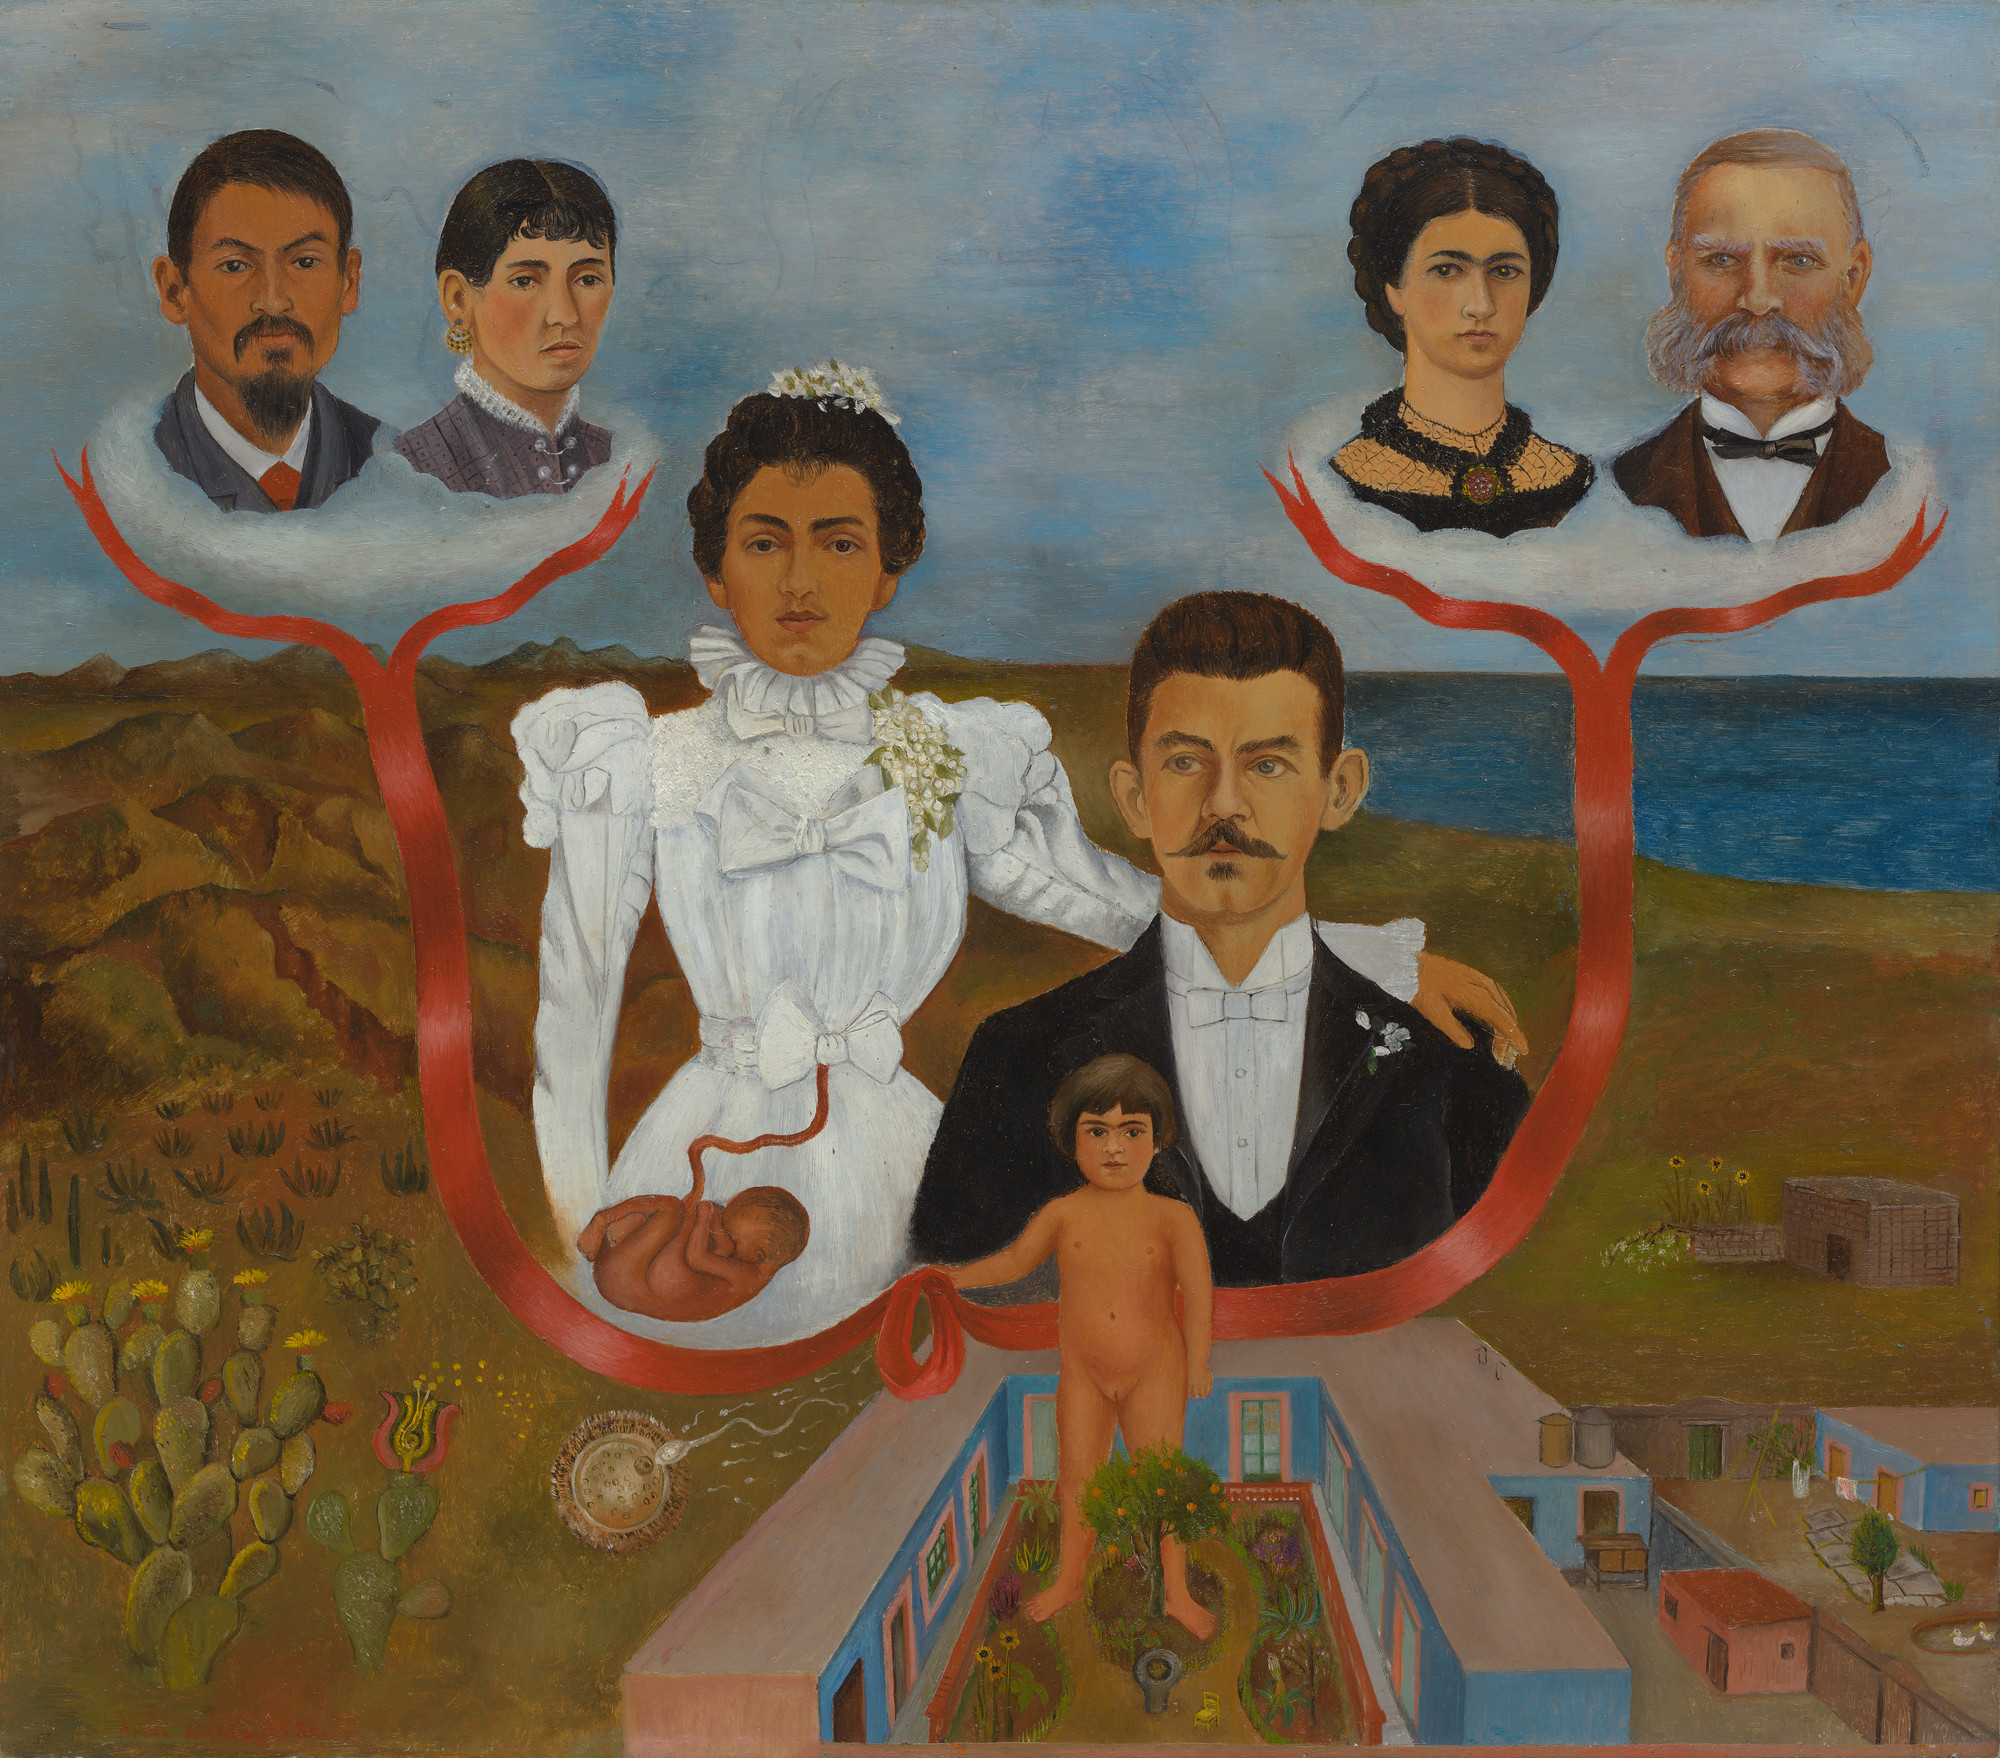
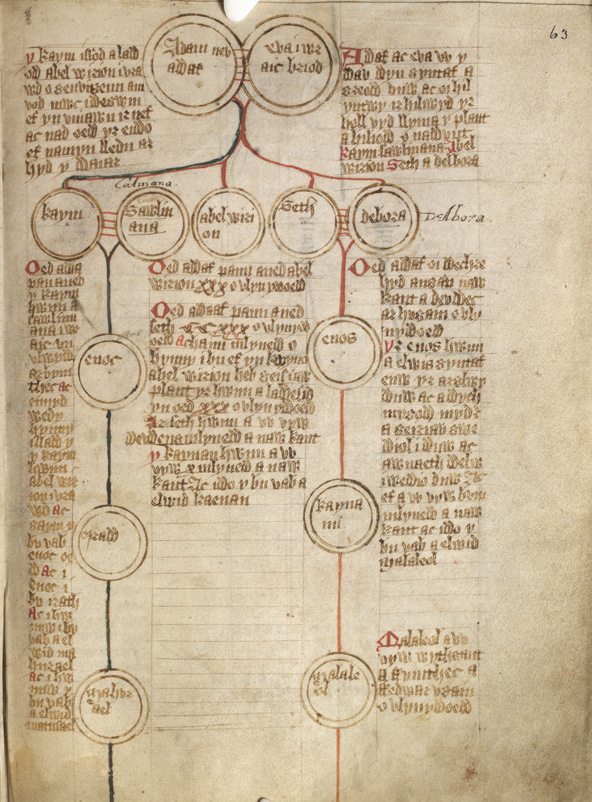
Genealogical data and visual design II: mixing metaphors

In our previous post, we discussed Edward Tufte’s notions about the rich visual expression of data, and we introduced some basic metaphors used in genealogical diagramming: trees, fans, roads, timelines, quilts, and networks. We observed any one of these can express perhaps one or two classes of data very well, but often at the expense…
-
Genealogical data and visual design I: metaphors in visualization

Will they tell your story? TimeWho lives, who dies, who tells your story? TimeWill they tell your story? TimeWho lives, who dies, who tells your story? — Lin-Manuel Miranda Genealogy is data… … but what does this data do? Well, for starters, it can tell your story. Data, alas, does not willfully do so. Left…