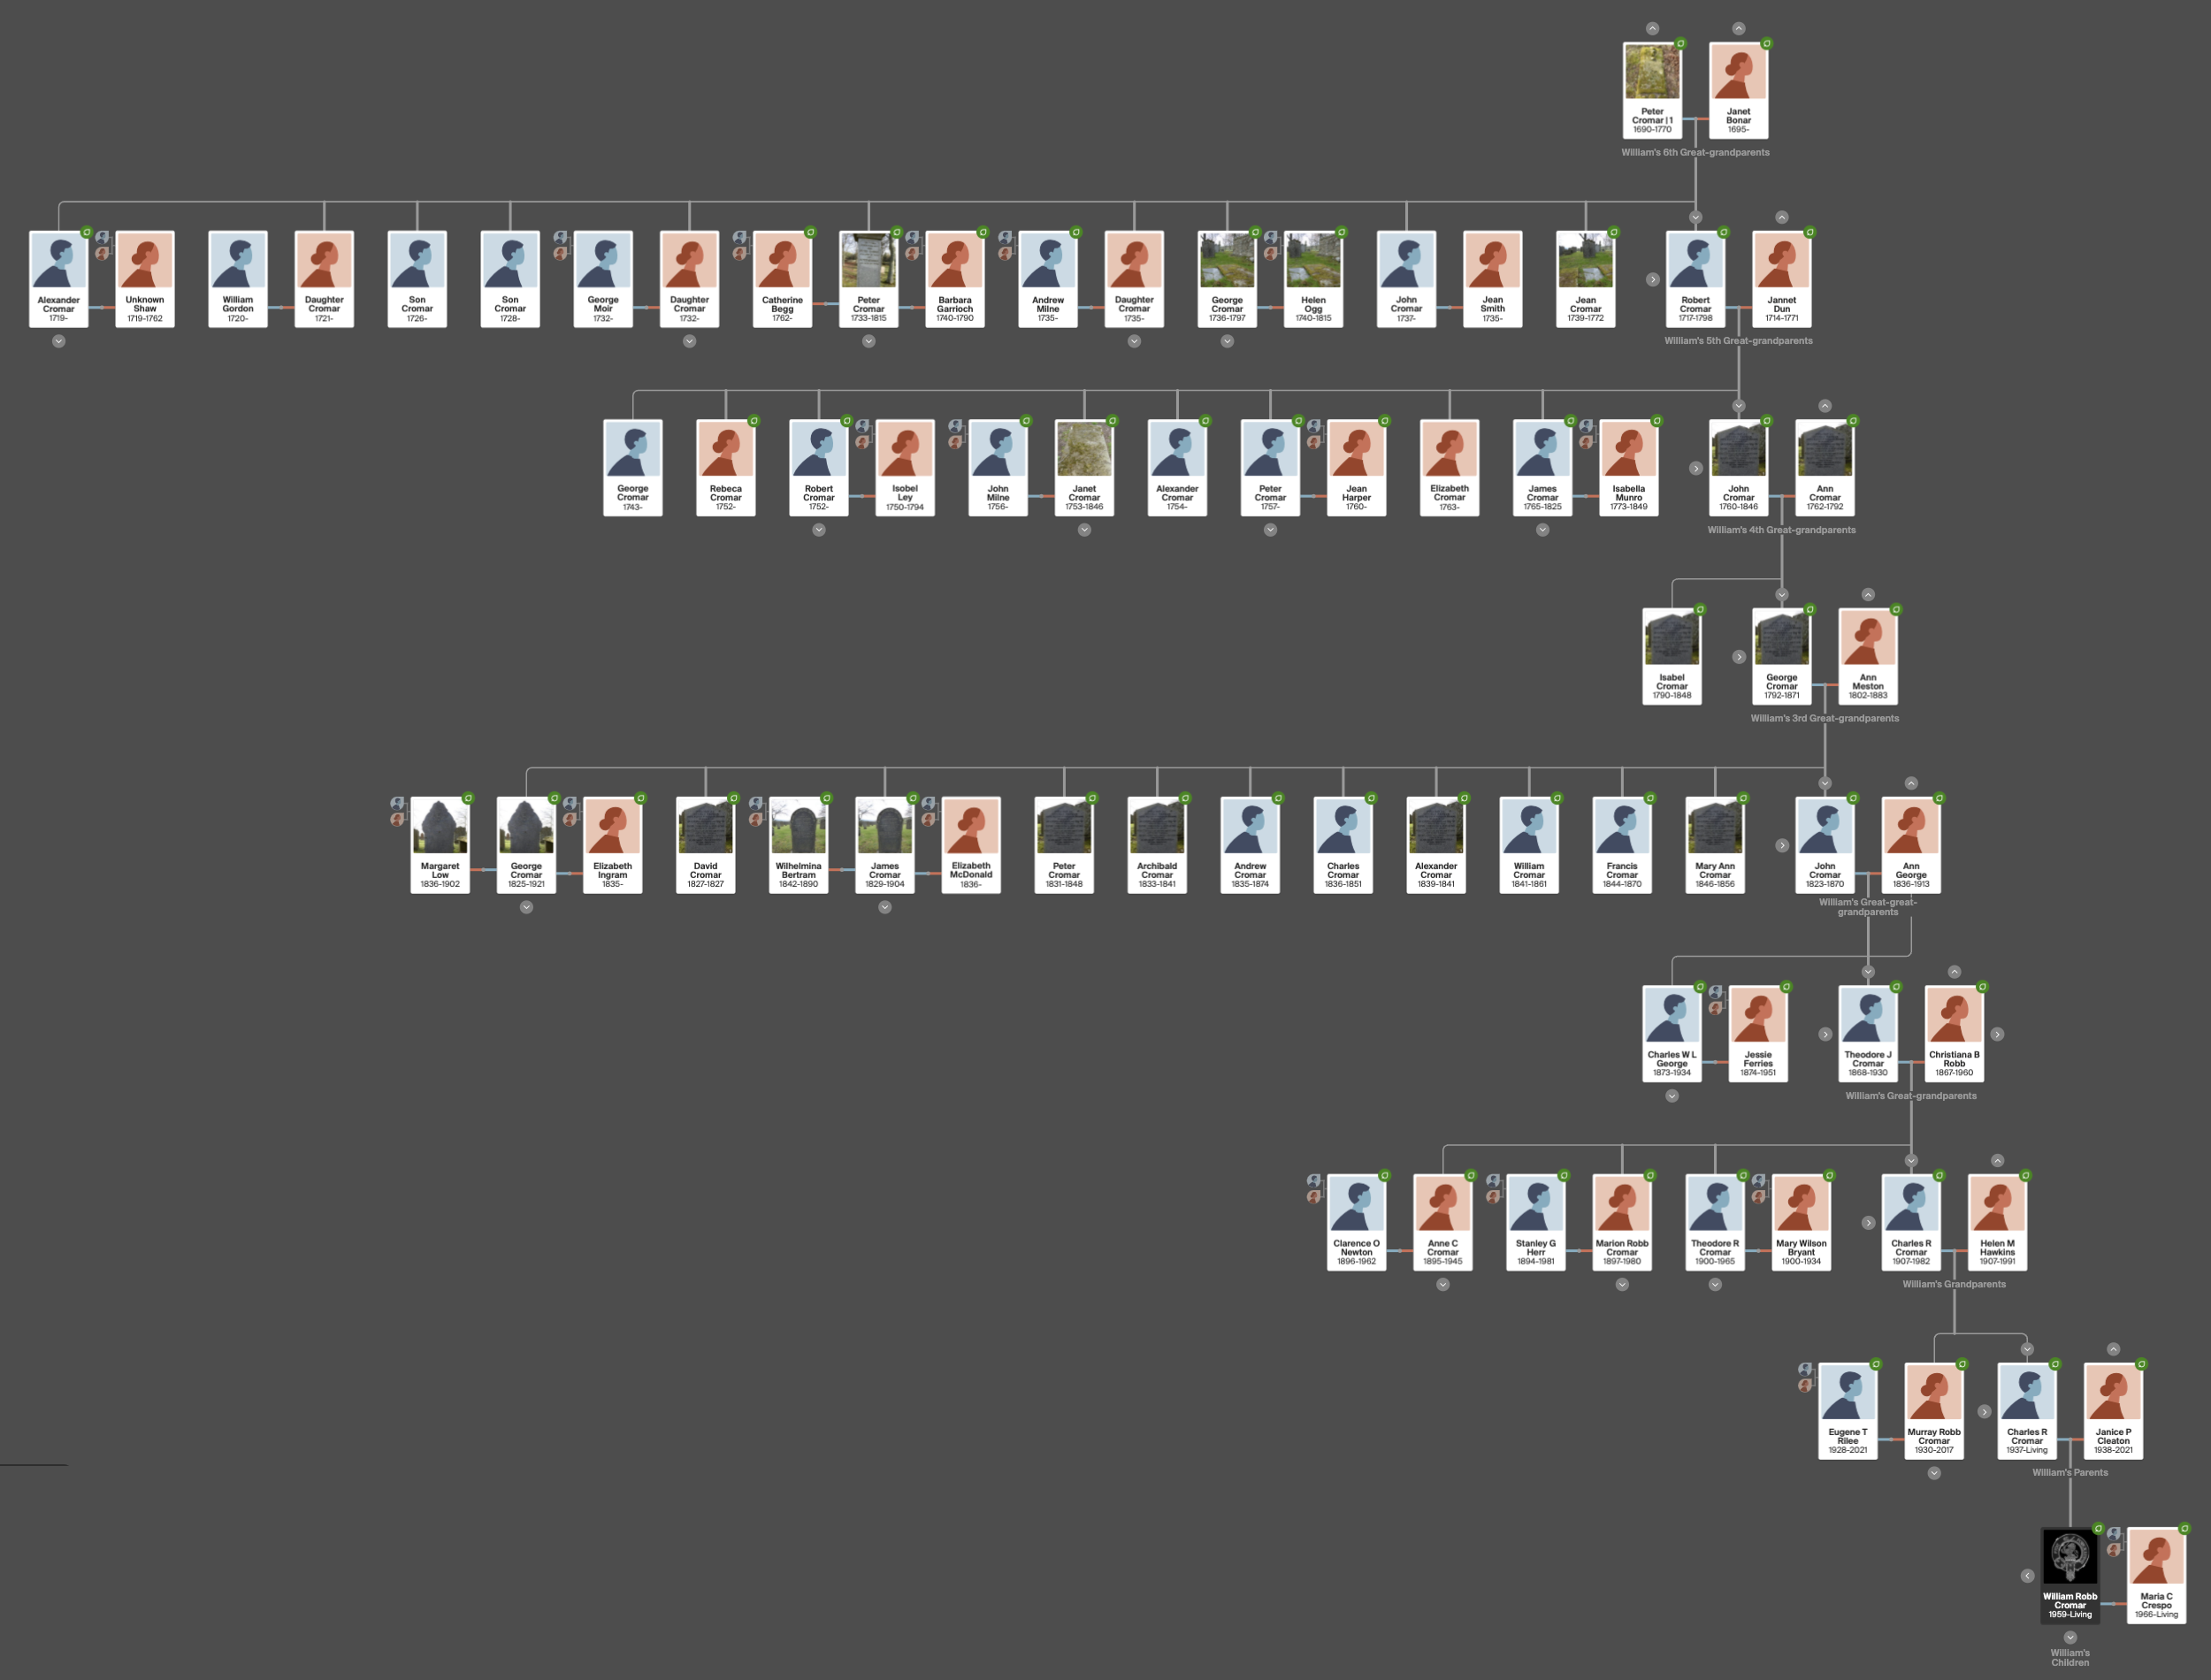


And to think this is still a work in progress as of this writing: the Cromar-Robb Hypothesis tree under construction. With 7 out of 9 generations finished, it may only be about 50% complete. Note the impossibly dense parent-child linkages in a tree of this magnitude, as well as the consistent generational growth pattern seen in the enlarged navigation window at bottom. Every person in this chart is a child, grand-child, or great-grandchild of Peter Cromar 1690. | Screen-captures from Ancestry with content generated by the author.
Well, I should have known what I was getting into. Really. Genealogy is not for the impatient.
When I first cracked open Paul Smillie’s PDF containing the genealogical notes of Ron Cromar, I was impressed by the apparent completeness of it all, and to be fair, it really is a ton of work that I can’t even comprehend anyone doing without access to today’s research tools. Without those notes, I would never have been able to tackle the expansive update to Ron’s work I’ve been compiling on nights and weekends since mid-November. But: Ron’s data turns out to be the tiny tip of a rather ginormous iceberg.
Massive numbers
What is both obvious and oblivious about doing this work is the sheer mathematical massiveness of it all. In the classic exponential growth formula, whereby simple cellular organisms double their numbers each generation, you can see that by the tenth generation, which contains 210 or 1024 new organisms, the total accumulated number across every generation is 2046. That’s an impressive number.
But people are not protozoa, and their reproduction patterns far outstrip exponential growth. Consider the large agricultural and working-class family groups found in Aberdeenshire of the 17th, 18th, and 19th centuries — socio-economically speaking, a time when family was a source of uncompensated labor, and pharmacologically speaking, a time when there was no reliable means of birth control short of abstinence. What does one get when accounting for average reproduction rates? A mind-bogglingly enormous number of people ten generations down the line.
How many? Here’s a though experiment anyone who is contemplating a comprehensive, deep-and-wide survey of an extended family should try. Assume a Generation 1: one progenitor and one spouse. The progenitor does not simply double in number. Rather the couple have (let’s say on average) 6 offspring. Of those offspring — Generation 2 now — let’s assume only half successfully reproduce, with others dying young or remaining single. These 3 each have 6 offspring — Generation 3 — half of whom reproduce. Assume this pattern holds true for subsequent Generations 4, 5, 6, et cetera. If you’re a math-y spreadsheet wonk, you can look at the raw calculations here, but these assumptions work out as follows:
| Descendant Type | Generation | Generation Total | Cumulative Total |
| Progenitor | 1 | 1 | 1 |
| Children | 2 | 6 | 7 |
| Grand-C | 3 | 18 | 25 |
| Great-GC | 4 | 54 | 79 |
| 2nd GGC | 5 | 162 | 241 |
| 3rd GGC | 6 | 486 | 727 |
| 4th GGC | 7 | 1458 | 2185 |
| 5th GGC | 8 | 4374 | 6559 |
| 6th GGC | 9 | 13122 | 19681 |
| 7th GGC | 10 | 39366 | 59047 |
It should be noted that these figures are for the direct line only from the progenitor, meaning no spouses or their parentage are included, though I do enter them in the Cromar-Robb database where they are recorded, increasing these basic numbers accordingly. As of this writing, I have just wrapped up the seventh generation out from my chosen progenitor: Peter Cromar 1690. This ongoing data entry has just topped out over 2400 persons, in close alignment with our thought experiment! Where this might end up is anyone’s guess, but looking ahead to Generations 8, 9, and 10, what can I do? This is taking over my life!
Well, fortunately, at least from the standpoint of finishing the task, persons on the record after Generation 7 begin to taper off, and dramatically so. In part, this is due to changes in reproduction patterns as we approach the 20th Century: people in an industrialized urbanized context with ready access to birth control won’t spawn as many offspring. This trend can also be attributed to the Scottish Diaspora, with families facing the hardships of emigration tending to have fewer children.
A third factor contributing to this melt is the nature of record-keeping itself. Access to data is generally limited to the deceased, protecting the privacy of living persons. As we approach Generation 8, we bump up against an elderly population in which a few are still living, but by Generation 9 — where I belong — a good number of us are still kicking around. Generation 10 is still young and, in some cases, a work in progress. Most members of Generation 11 are still a collective twinkle in our eyes!
Accounting for all of these factors, I anticipate a significant drop in data entry for later generations. Not that a lot of those lost persons aren’t there, mind you — simply that my access to them is restricted. Where the abstract thought experiment would lead to nearly 60,000 impossible entries in a database, I’m anticipating a more manageable 4,000 to 5,000 entries. I may be working on this for the next 6 months, but it won’t last forever.
Methodology
Like most people creating a family tree online for the first time, I created an ancestry chart. That is, I began with myself and went backward in time, filling in parents, grandparents, great-grandparents and on down the line. The results were terrible, not because it was an ancestry chart, but because I had no idea what I was doing. For starters, I fell prey to crowd-sourced, unverified claims in an echo chamber of “hints” which I took at face value. I didn’t understand the strict praxis that informs genealogical research. I learned quickly, but not quickly enough, to avoid making a foolish chart and, worse, to see my borrowed unsourced claims root their way back into the poisoned soil of a spurious reality, a crooked tree of mythology posing as history. Not being a fan of alternative facts, I had to undo the damage.
Descendancy vs. ancestry
Ron Cromar’s database was the catalyst for action. I opened it only to discover a curious form of charting. Instead of starting with himself, he started with Peter Cromar 1690 of Kirkton of Aboyne, the same individual I had been chasing down for nearly two years. I had known that Ron was aware of Peter Cromar, as were several others who had explored the Cromar name. However, it had never occurred to me that one could build a chart for a progenitor. One simply has to invert the orientation of the diagram.

1 | An ancestry chart starts with a single living person and expands backward in time to find parents, grandparents, and so on — a great way to explore many progenitors. At the tenth generation back, you’ll have 1024 of them, assuming you can find them all in a record somewhere!
2 | Invert the diagram for a descendancy chart, starting with a progenitor and moving forward in time to find every descendant of that historical person. The number of descendants at the tenth generation ahead will outnumber progenitors by several orders of magnitude, even if more than half of them are missing from the record!
3 | An example from my work in progress, showing all the children along a direct line from Peter Cromar at the top, finishing with me and my sister in Generation 9 at the bottom. One can expand this chart to include every descendant, as seen in the image at the top of this post. It’s a cast of thousands.
Image 1 and 2: Free Icons Library | Image 3: Screen-capture from Ancestry using data provided by the author
What’s the difference?
Descendancy research is quite different than ancestry, as described in this document from Family Search:
- It literally adds a different dimension and perspective to family history. In ancestry, you discover all your progenitors, but at the cost of learning about the extent of your current, living family. By choosing the right progenitor — reasonably well documented, with many offspring — the sheer size of a family can be understood.
- Descendancy can reveal emigration patterns that ancestry will obscure. In the case of the Cromars, we discover migration to New Zealand, Australia, southern Africa, Russia, Wales, England, many provinces in Canada, the American Mid-West (mostly Michigan) and West (mostly Utah).
- Second, third, fourth, fifth, and sixth cousins can be found all over the world, sporting a range of allied family names that can help make sense of the seemingly random matches listed at a DNA testing service like Ancestry or MyHeritage. I’m not baffled by a Durward, a Buckner, or a Herr listed in my matches anymore because I know exactly where and how they arrived in the line.
Developing an ordering system
After realizing how hard it is to keep track of identities with so many people (and worse, so many Cromars sharing identical names like dozens of Johns, Georges, Roberts, and even Williams!), I realized I had to select or invent a numbering system.
Ron’s numbering system seemed a bit idiosyncratic. using a combination of Arabic and Roman numerals separated by periods. The Arabic designations appeared random: some did and some did not carry one. Upon researching this I discovered he used an orthodox version of a Register System, which looks like this:
(–Generation One–)
1  Progenitor
     2     i  Child
          ii  Child (no progeny)
         iii  Child (no progeny)
     3    iv  Child

(–Generation Two–)
2  Child
           i  Grandchild (no progeny)
          ii  Grandchild (no progeny)
3  Child
     4     i  Grandchild
There’s a half-dozen other systems out there, but almost all of them have some variation of Roman numerals or letters that I find either visually sludgy or not useful. My goal is to track persons by 1) generation and 2) birth order while avoiding visual sludge, so I created a mash-up combining a generational logic similar to the Meurgey de Tupigny System with the listing logic of the Register System and the generational numbering convention used in software development. Instead of the barely-legible Roman numeral — dash — Arabic numeral convention used in du Tupigny, I supply Arabic numerals, separating generation from birth order by a dot. Instead of IV—3 to indicate a third great-grandchild, for example, I use 4.3. One traces lineage by listing a count-down of the numbers parenthetically after the name, giving each person a unique identifier. For example, in my system, I am listed:
9.1 William Robb Cromar (8.2, 7.4, 6.1, 5.1, 4.2, 3.6, 2.1, 1)
This indicates I’m William Robb, first child of Charles Robb, second child of Charles Robb, fourth child of Theodore James, first child of John, first child of George, second child of Peter, sixth child of Robert, first child of Peter Cromar. Perhaps I’ll be credited with inventing a new genealogical ordering system someday!
(–Generation One–)
1    Progenitor
     2.1  Child (1)
     2.2  Child (1) (no progeny)
     2.3  Child (1) (no progeny)
     2.4  Child (1)

(–Generation Two–)
2.1  Child
     3.1  Grandchild (2.1, 1) (no progeny)
     3.2  Grandchild (2.1, 1) (no progeny)
2.4  Child
     3.1  Grandchild (2.4, 1)
Compilation tools
The principal tools I’m using for the compilation of data are:
- Google Docs | This is the database where my updates to Ron’s original descendancy study of Peter Cromar are being edited. I’m using Ron’s research as a scaffold to guide my own, expanding on his work, and correcting where needed.
- Family Search | I appreciate the “one-tree” communal database collaboration found at this free site, and the community of users is generally (but not always) much more careful than the walled-garden trees found at subscription sites like Ancestry or MyHeritage. There is a robust search function for record repositories that can be used to verify and back up database claims. The downside: if a product is free, then the user becomes the product. In other words, a pretty powerful organization has access to a lot of my personal data. Family Search is an affiliate of the Church of Jesus Christ of Latter-Day Saints, or LDS for short (not that I’m LDS-phobic, it should be said: I’m an equal-opportunity skeptic when it comes to institutionalized religion).
- Ancestry | Readers of this journal are more than well aware of the contempt I heap upon sites of this ilk, both for their business model (Ancestry’s tag line is “We’re giving you access to your history.” No you are not. You are tricking gullible people into paying a subscription fee for middle-man gate-keeping to information in the public domain. Shame.), and for the lack of curatorial rigor in the crowd-sourced data entry pushed into one’s data via so-called “hints.” Regardless, I use it because 1) they have my DNA profile, which in turn supports 2) a reliable analysis of ethnicity, and 2) these are helpful in finding patterns among extended family members. Their un-gated data management system also allows one to freely develop a dataset that can be separated from Family Search’s “one tree” for the purpose of 1) doing a pure descendancy study and 2) creating a GEDCOM file with data already backed up in the cloud. But let’s be clear: I am NOT taking the bait on an Ancestry subscription, nor am I tempted to reference their “hints” when Family Search and other sites provide ample free or low-cost access to public records. Having said that, I recently learned faculty may have access to Ancestry as researchers through the University Library system, so watch this space.
- ScotlandsPeople | Births, deaths, marriages, and other data can all be confirmed here if there is not access to records at Family Search. Payment is required for copies of records, but this provides reasonable support for the repository directly, rather than being an opportunistic middle-man cut.
- Find a Grave | Data can be confirmed at this site, which uses headstones as a primary source. If it’s set in stone, it’s a primary source.
- GENUKI | Old maps with obscure place-names to correlate with…
- Google MyMaps | … a custom formatted map expressing geographic data.
- GRAMPS | It sports a user-interface only a mother could love, but the advantage of GRAMPS is clear: an open-source, free research software that can receive the GEDCOM file being compiled in Ancestry.
Reconciling databases
The goal of the process is the creation of a clean, reliable database. Since data comes from many sources, and since those sources can in turn create errors, competing hypotheses, holes, and contradictions, a huge piece of this effort which I did not entirely anticipate was the reconciliation of data across these various sets. This is the time-consuming part, but it is yeoman’s work, because it can help other people who may have come across anomalies in their research.
This is where the ingenuity of Family Search database development really shines. It’s not a gaggle of separate trees linked with “hints.” It’s called the Family Search Family Tree and it is One. Colossal. Tree. It puts the Big in Big Data: in September 2020 Family Search announced it had 8 billion individuals available to search, and it’s adding about a million new records every day. I’ll leave the math to you to see how many more have been added since 2020.
In addition to the collective colossus of the Family Search dataset, I have Ron Cromar’s dataset, and my own in Ancestry. Each of these three datasets performs a specific function in the compilation, and thus they all need to be reconciled with one another.
A double-entry system
You can see in the Google Doc how I’ve created the genealogy equivalent of a double-entry bookkeeping system. On the left of the page, we find Ron’s notes unaltered. In the right column, my revisions and additions. Those adjustments are largely taken from Family Search. But Family Search, while excellent, is far from perfect. I spend many hours there fixing incorrect data, standardizing dates and geographies, finding and attaching sources, merging duplicate entries. and so forth. I’m not satisfied until these are cleaned up to the best of my ability, and I create collaboration notes where I don’t feel competent to modify an entry. I dearly want to avoid repeating what I had witnessed happening to Robert Cromar in the second generation of my line, foisting poorly-informed merges on some unsuspecting family branch!
Only when I’m satisfied with the Family Search entry do I carry it over to the adjustment document for Ron Cromar’s database. This affects changes on that database where there are missing entries or incorrect hypotheses — and sometimes Ron gets it right and forces a change in Family Search! It is only when those two databases are in agreement that I transfer that information into the Cromar-Robb Hypothesis tree in Ancestry.
On to GEDCOM
Once this exacting process is concluded, I will export a GEDCOM file out of Ancestry to import into GRAMPS. What I will do with the data then remains to be described in a future post. Meanwhile, the next few posts in this series will explore some observations I can reliably make about this process, including:
- The many “missing link” Cromars in the record who are not directly of this line…
- … the allied families of the Cromars who marry into the line or extend the line to other names through marriage and offspring…
- … the role of the Cromars in the Scottish Diaspora…
- … and other random oddities and surprises…
Leave a Reply